Summarize this article with:
The Net Promoter Score (NPS) is a metric that measures the likelihood of a customer recommending a company, on a scale of 0 to 10. Introduced in 2003 by Fred Reichheld in the Harvard Business Review ("The One Number You Need to Grow"), NPS has become a standard for measuring customer satisfaction and customer experience — particularly in B2B organizations and SaaS companies. Simple to understand, based on a single question and a clear rating scale, it is widely perceived as a key indicator of customer health, service quality, and client relationships.
According to Bain & Company, more than two thirds of Fortune 1000 companies use NPS as a performance metric. Furthermore, according to Retently (NPS Benchmarks, 2023), the average NPS score in B2B SaaS sits at 36 — a figure that often falls well below what teams expect when they start tracking it. In many organizations, the NPS score is monitored monthly, analyzed as a steering metric, reviewed in executive committees, and compared quarter over quarter to track progress, identify trends, or assess satisfaction levels.
For many teams, tracking NPS becomes a reflex for measuring customer satisfaction, evaluating experience, and monitoring customer loyalty.
Yet a persistent unease remains.
In many B2B organizations, NPS is now used far beyond its original purpose — as a tool to explain problems it was never designed to address. Problems like analyzing deal losses, declining win rates, stagnating commercial pipelines, or the failure to convert well-advanced opportunities — despite high or even positive NPS scores.
The Net Promoter Score is not a bad metric. It is simply misused.
NPS in B2B: a useful but misused metric
Before addressing NPS limitations in B2B, it is worth recalling why the Net Promoter Score became so widely adopted across industries — and why it remains, in certain contexts, a genuinely useful metric.
Why it is useful ?
- Simplicity: a single survey question, easy for customers to answer, with minimal cognitive effort
- Readability: a score that is easy to read, compare, and track over time
- Comparability: a recognized benchmark that allows companies to position themselves against their market, sector, or a competitor
Through this measure of customer satisfaction, teams can identify satisfied customers (promoters), passive customers, and dissatisfied customers (detractors), assess the likelihood of recommendation, and gauge whether customers would be inclined to refer the company to others.
Why it provides comfort ?
Beyond its practical advantages, NPS reassures organizations for more implicit reasons tied to the nature of the data itself:
- a single number
- an easily interpretable average
- a clear reference point for steering decisions
A positive NPS creates the sense that customer relationships, retention, and loyalty are moving in the right direction. Conversely, a negative NPS is perceived as an important signal, indicating the need to act or improve the customer experience.
This result, often treated as a decision-making foundation, appears complete and easy to use. But that apparent simplicity hides a major limitation: NPS says nothing about the why behind a response, nor about the implicit question decision-makers are actually asking.
Why NPS cannot explain deal losses ?
In many sales, marketing, and RevOps teams, NPS is used as an analytical input to try to make sense of complex business situations:
- Why are well-advanced deals being lost despite a high NPS?
- Why is the win rate declining when survey responses are positive?
- Why is the pipeline stalling despite strong product adoption and high NPS scores?
In these situations, the NPS score is often interpreted as an explanatory variable for commercial outcomes.
NPS cannot answer these questions.
NPS measures a perception, not a decision
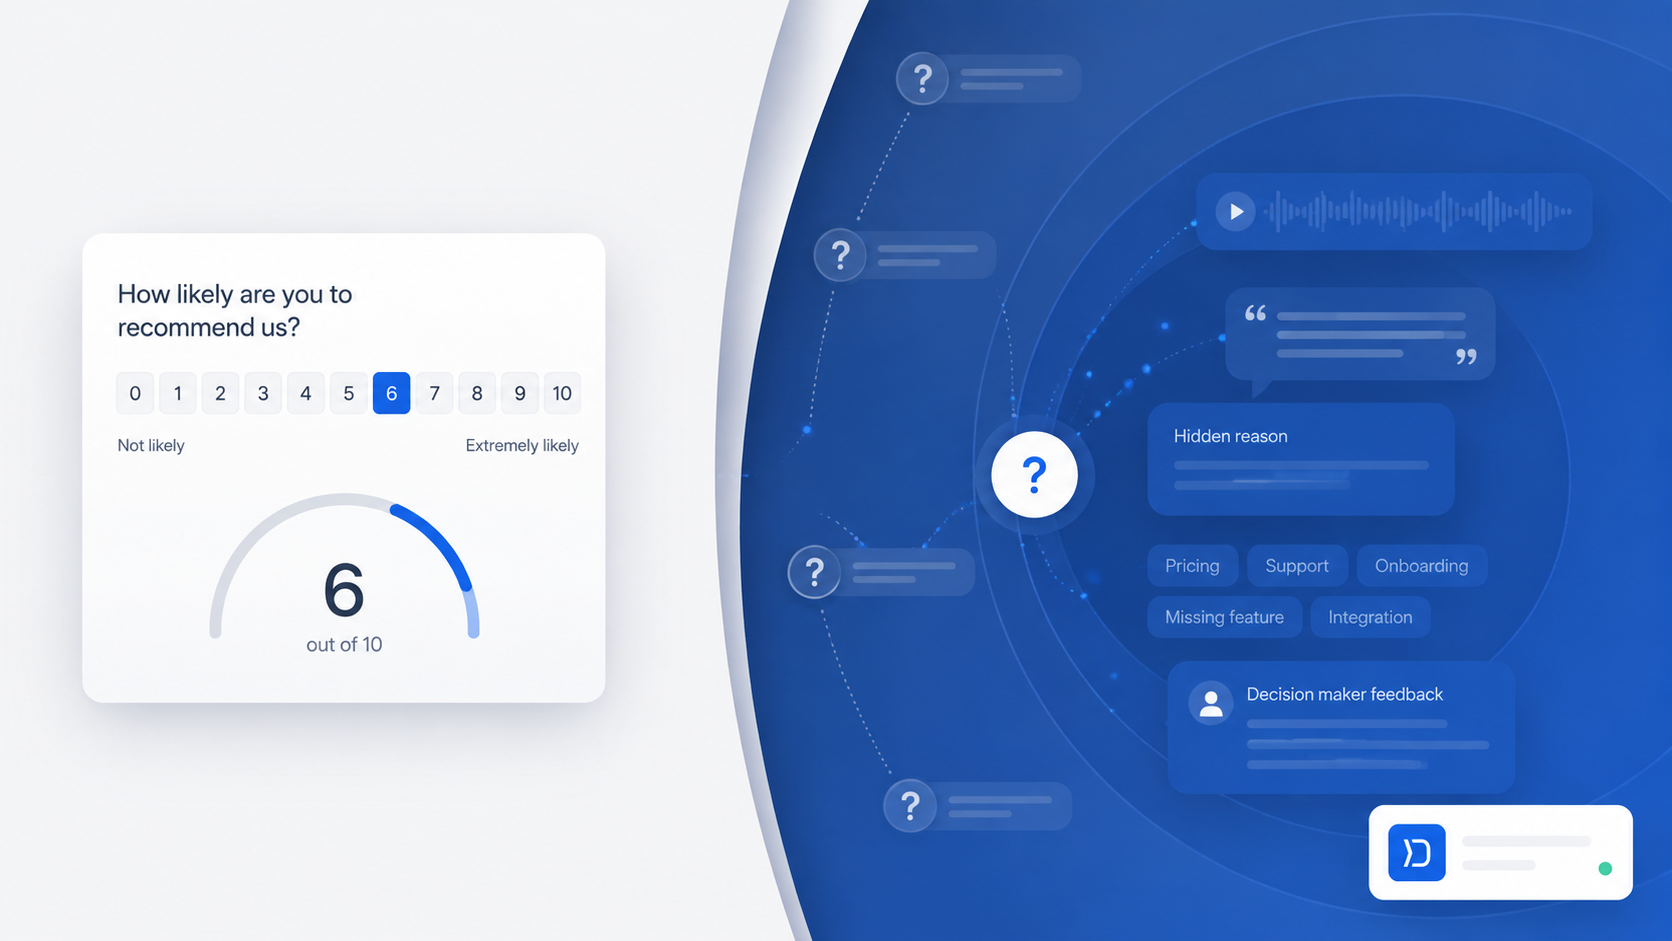
The Net Promoter Score was designed to measure customer satisfaction and evaluate customer experience at a given point in time, through a simple question asked in an NPS survey.
NPS can measure:
- post-experience customer satisfaction
- perceived product or service value
- recommendation intent, that is, the likelihood that a customer would recommend a brand
NPS cannot measure:
- a budget trade-off within a company
- a collective buying decision
- internal power dynamics
- a competitive choice between alternatives
A concrete example: an IT manager at a mid-market SaaS company may give an excellent NPS score, become a promoter, and submit a positive survey response, yet still not renew the contract. The decision not to renew was made by a CFO facing a budget freeze, with no connection to the user's satisfaction.
The perception was positive. The decision happened elsewhere.
On criteria that NPS, as a customer satisfaction metric, cannot identify or evaluate.
The voice NPS measures is not the voice that decides
In B2B SaaS, NPS respondents are mostly operational users, the people who log in daily, navigate a poorly designed onboarding, work around a flawed feature, or finally save time when a product improvement ships. When they give a 9 or a 10, they are not saying "we're going to buy" or "we're going to renew." They are saying: "this tool helps me in my day-to-day work."
But if, in parallel, the win rate is dropping or the pipeline is frozen, that NPS score will not explain why. The decision is not made at that level. It happens higher up: in a committee arbitrating priorities, in a tightening budget, with a CFO who prefers to delay, or in a status quo that feels less risky. NPS speaks to usage, adoption, and perceived value. It will never speak to that precise moment when, despite all of that, someone decided to say no.
What NPS fails to measure in a B2B decision ?
The limitations of NPS in B2B become apparent as soon as one looks at the reality of purchasing decisions.
Structurally invisible factors
By design, NPS fails to capture much of what actually weighs on a B2B decision:
- the status quo, often perceived as the safest and simplest option
- internal politics and influence dynamics
- the presence or absence of an internal sponsor capable of championing the project
- cross-functional trade-offs between competing initiatives
- the real timing of decisions: budget freezes, shifting priorities, leadership changes
Forrester Research (B2B Buying: 2023 Benchmark Study) confirms that 74% of B2B purchase decisions are influenced by internal organizational factors that satisfaction surveys simply do not capture.
These elements, rarely formalized, are precisely what explains why a deal is won, lost, or stuck indefinitely without ever moving forward.
The reality of decisions in B2B SaaS
In B2B SaaS, a buying decision is rarely individual or strictly rational. It rarely rests solely on the perceived quality of a product. More often than not, it is collective, constrained by competing priorities, shaped by internal dynamics, and in many cases, defensive.
Gartner (The B2B Buying Journey, 2022) highlights that a B2B buying group involves an average of 6 to 10 decision-makers, each with their own evaluation criteria. NPS, by surveying a single user at a single point in time, does not reflect this collective reality.
NPS was never designed to analyze this kind of decisional complexity. It measures a perception at a given moment. It explains neither the trade-offs nor the mechanisms that lead to a final decision.
NPS and organizational comfort: why teams stick with it anyway
NPS is so frequently over-used in B2B not out of naivety or ignorance — but very often out of organizational comfort.
An already-embedded metric
In many B2B organizations, NPS is deeply embedded in existing tools, executive dashboards, and operational routines. A study by CustomerGauge (B2B NPS & CX Benchmarks Report, 2023) found that 83% of B2B companies with an active NPS program have been tracking it for more than two years, underscoring just how entrenched the metric has become. Challenging it requires real structural effort: revisiting established habits, changing long-tracked indicators, and accepting a period of uncertainty.
That effort is often perceived as costly, risky, or hard to justify which explains why NPS continues to be used even when its limitations are well understood.
A "Board-Ready" metric
A single score is easy to present, easy to comment on, and easy to compare. It avoids the complexity of field-level decisions, internal trade-offs, or the contradictions between perception and commercial reality.
Understanding a commercial loss, by contrast:
- exposes blind spots
- challenges the narrative
- reveals positioning inconsistencies
- creates discomfort
Discomfort is rarely sought after in established organizations. This is precisely where Win/Loss analysis offers a complementary answer.
What a Win/Loss Analysis is actually designed to reveal ?
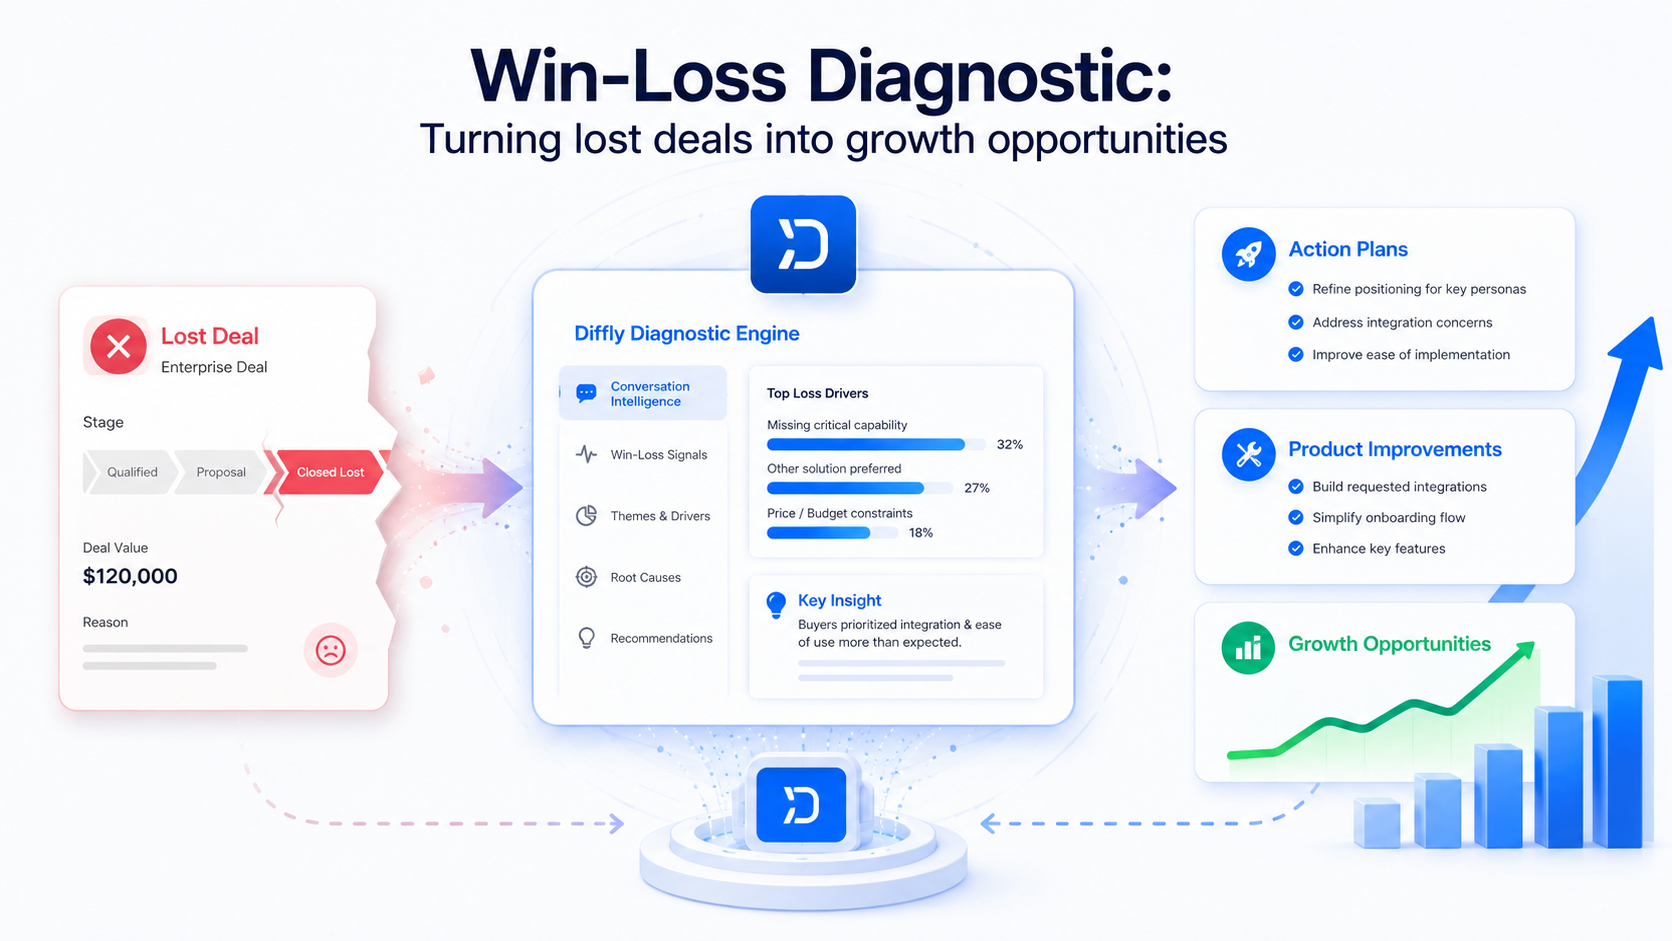
Win/Loss is not a simple feedback tool. It is a decisional analysis.
A Win/Loss analysis does not seek to measure a feeling, it seeks to reconstruct a decision-making process. The goal is to identify who actually drove the decision, why one option was chosen over another, and at what precise moment the deal tipped.
Win/Loss analysis also surfaces what blocked the deal, even when the overall experience was perceived positively. Where a satisfaction metric stops at an impression, Win/Loss illuminates the real logic that led to the final decision.
NPS vs Win/Loss: A comparison
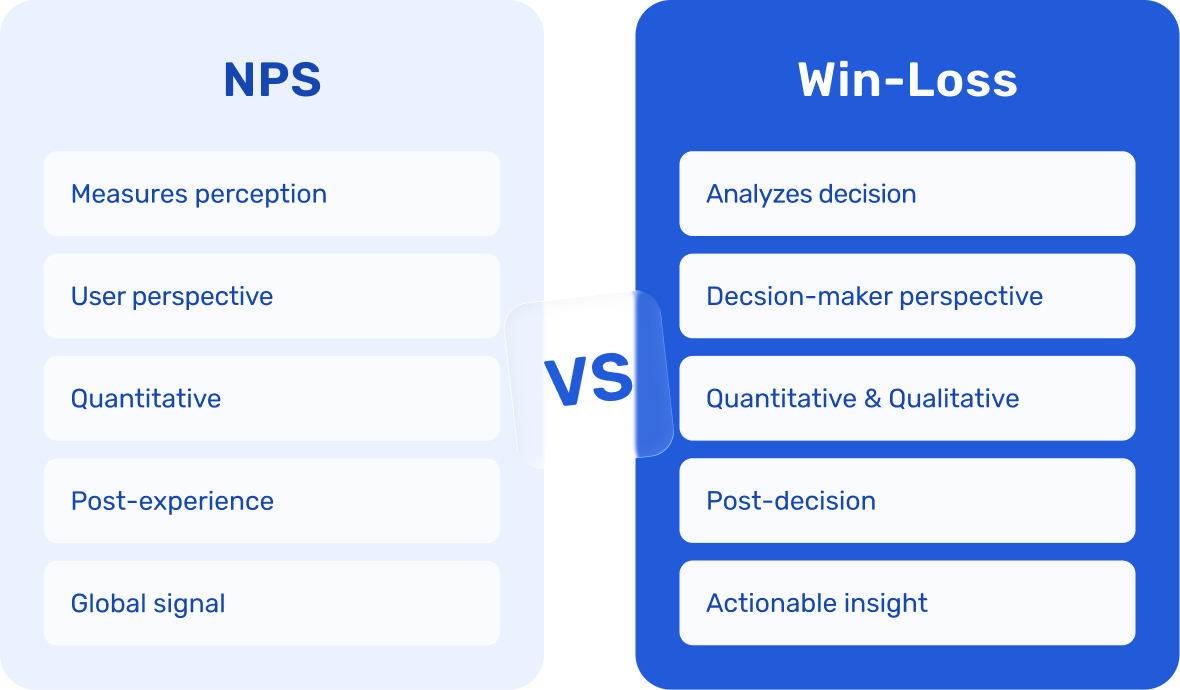
Key point: Win/Loss does not replace NPS. It answers different questions.
Why NPS and Win/Loss are complementary ?
Pitting NPS against Win/Loss makes no sense in B2B.
- NPS illuminates the relationship
- Win/Loss illuminates the decision
One measures what users feel. The other explains why a decision was made or not. This complementarity allows SaaS teams to connect the experience lived by users to the real trade-offs made by decision-makers.
At Diffly, this complementarity is central: NPS captures user perception, while Win/Loss interviews provide access to the reasoning of decision-makers. According to Primary Intelligence (Win-Loss Analysis Benchmark, 2022), teams that combine NPS and Win/Loss improve their average conversion rate by an additional 28% compared to teams using only one of the two approaches.
Conclusion
The NPS score identifies promoters, passives, and detractors, tracks customer satisfaction, and guides service improvement. But using NPS to explain a purchasing decision remains a strategic mistake for any B2B company.
NPS remains a useful metric, as long as you ask it the right question.
Win/Loss becomes indispensable the moment the goal is to understand a decision.
This is not a debate about tools. It is a debate about questions.
Frequently asked questions about NPS in B2B
Does NPS still make sense in a B2B context?
Yes. NPS remains relevant in B2B when used to track user perception and the evolution of customer experience over time. Its relevance diminishes when asked to explain complex purchasing decisions or organizational trade-offs.
Why doesn't a strong NPS prevent deal losses?
Because a B2B deal is not won solely on the basis of perceived satisfaction. Decisions are often driven by budget constraints, internal priorities, political dynamics, or the inertia of the status quo, none of which NPS measures.
How can NPS be complemented to better understand commercial performance?
By combining NPS with Win/Loss analysis. Where NPS illuminates usage and perceived value, Win/Loss uncovers the real decision mechanisms and the concrete reasons behind a win or a loss.
Do NPS and Win/Loss answer the same questions?
No. NPS informs on the relationship and lived experience. Win/Loss focuses on the final decision: who decides, why, and at what point the choice is made. They are two different readings of the same reality.
Should you choose between NPS and Win/Loss?
No — and that is a key point. In B2B SaaS, combining both is often the most effective approach: the Net Promoter Score to understand how users feel, Win/Loss to analyze the decisions made at the company level.
Sources: Fred Reichheld, "The One Number You Need to Grow", Harvard Business Review, 2003; Bain & Company, "Net Promoter Score Benchmark Study", 2022; Retently, "NPS Benchmarks", 2023; Gartner, "The B2B Buying Journey", 2022; Forrester Research, "B2B Buying: 2023 Benchmark Study", 2023; CustomerGauge, "B2B NPS & CX Benchmarks Report", 2023; Primary Intelligence, "Win-Loss Analysis Benchmark", 2022.

Richtext Templates

"Lorem ipsum dolor sit amet, consectetur adipiscing elit. Suspendisse varius enim in eros elementum tristique."
John Doe
Name, Role @Google

Analysing CRM data is a good 1st step but I know I only get 20% of the real story

Constance Morales
Constance Morales, Product Marketing Manager @ Scaleway