Summarize this article with:
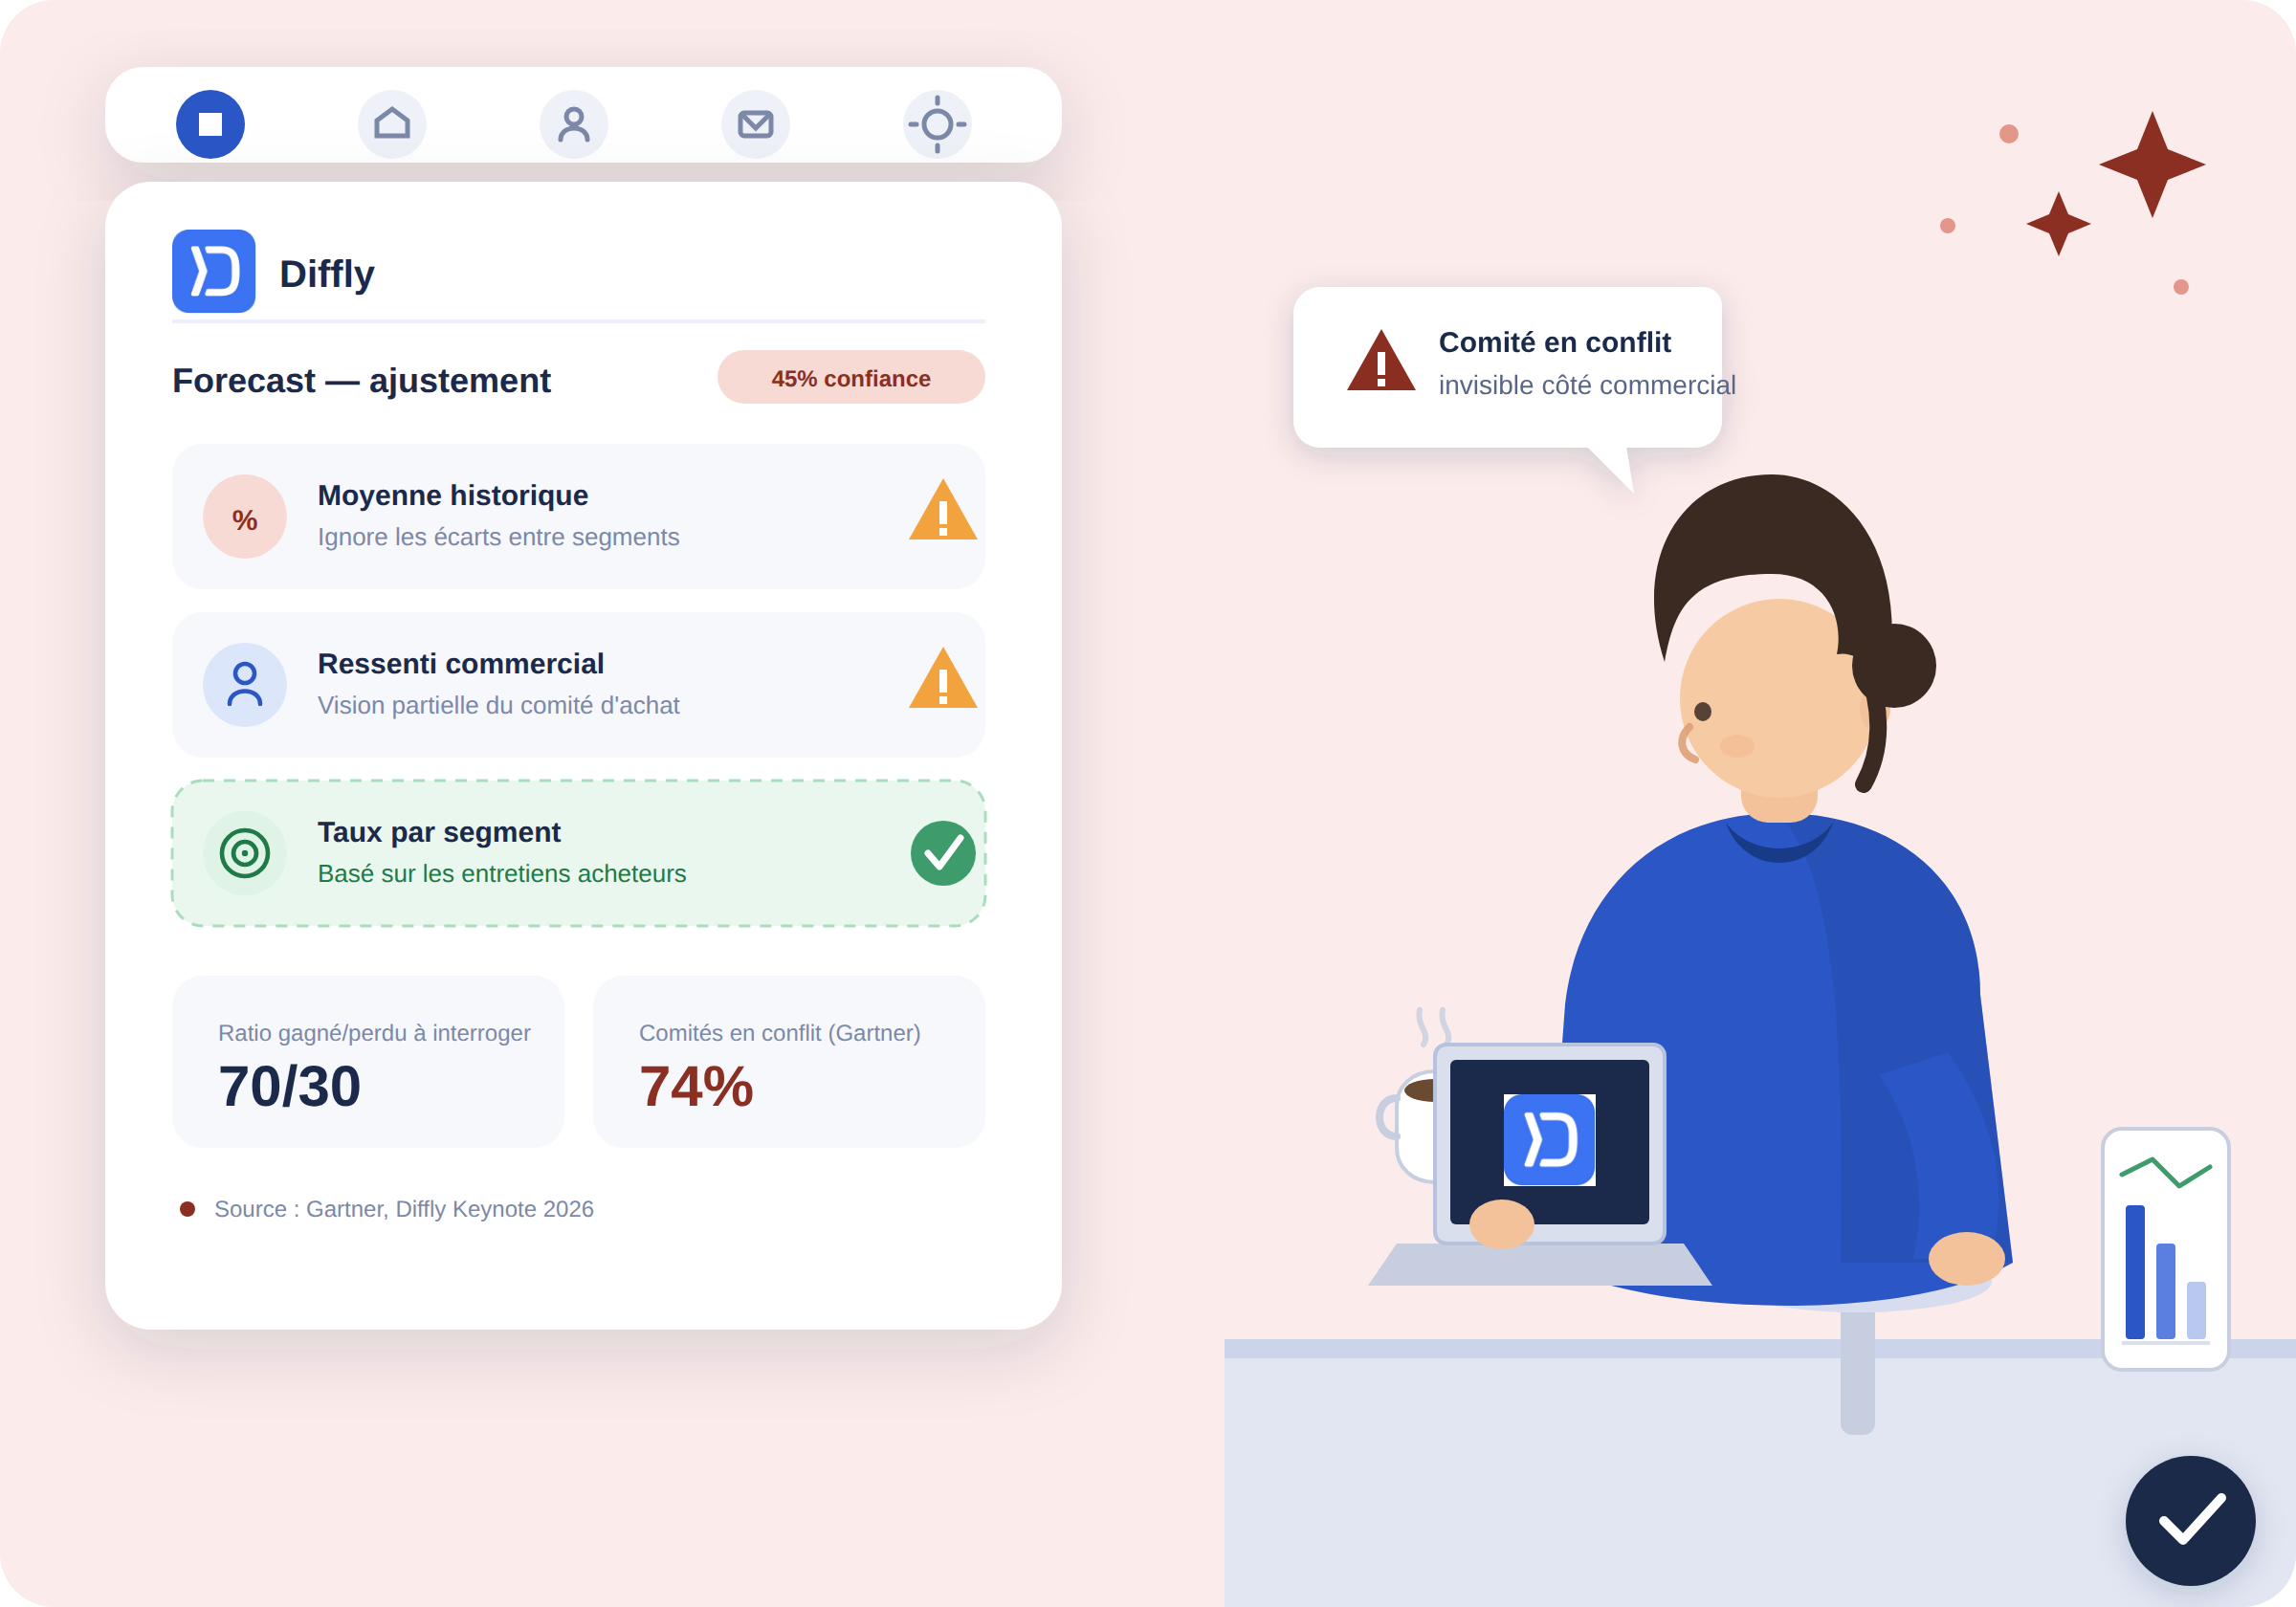
A sales forecast is a revenue prediction based on closing probabilities assigned to each pipeline stage. Those probabilities almost always come from two sources: the company's historical average and the sales team's gut feeling about their deals. According to Gartner, only 45% of sales leaders and reps have high confidence in the reliability of their forecast, a figure that has no reason to improve as long as these two sources remain the only ones used.
Why does a historical average distort the forecast?
Because it assumes that all deals at the same stage are alike, which they are not.
The same pipeline stage does not mean the same thing on a segment where you win one deal in two and on a segment where you win one in ten. The average overvalues the second and undervalues the first, even though the customer's decision depends on factors the average cannot see: the size of the target market, the maturity of the need, the structure of the buying committee. A segment where deals are easy to win cannot be compared to a segment where every deal is a close fight.
The effect intensifies when the pipeline's composition changes. A team prospecting a new segment sees its real win rate drop well before the average reflects it, because the average takes several quarters to absorb the change. Understanding this gap requires analyzing the pipeline by segment, not just by stage.
Why does sales reps' gut feeling drift?
The problem is not the sales team's optimism, it's their vantage point on the deal.
A sales rep sees their direct contacts. They do not see the entire buying committee, the internal meetings, or the customer's real decision criteria. An individual contact who seems engaged is not always representative of the rest of the committee's position.
A buyer who responds quickly and asks questions looks engaged. Sometimes they are simply justifying a decision already made elsewhere, and nothing in their visible behavior lets you tell them apart from a buyer who is genuinely convinced.
Certain committee configurations kill a deal without anyone seeing it from inside the deal. According to a Gartner survey of 632 B2B buyers, 74% of buying committees show an unresolved level of internal conflict during the decision, and committees that reach consensus are 2.5 times more likely to rate their own purchase as successful. A veto-holding stakeholder entering the process late is one of these risky configurations, invisible to the person running the deal.
How do you apply these four adjustments?
Running this exercise properly takes discipline, but the following four adjustments apply separately depending on the organization's maturity.
- Replace the single average with a grid of rates by segment. From several dozen interviews, you obtain real conversion rates by prospect type, committee size, and competitive context. This baseline becomes the reference to use instead of the overall average.
- Identify at-risk committee configurations. These interviews reveal who really decides and at what point. A veto-holding stakeholder entering late is a spottable configuration, and therefore a concrete weighting criterion.
- Build early loss signals into qualification. Post-mortems surface recurring patterns: stalled deals, unanswered questions, no access to senior levels. These signals become objective criteria, not individual impressions.
- Bring paused deals back into the pipe. Some deals marked as lost are not final failures. A conversation reveals this in thirty minutes, and these deals carry a real, non-zero probability that is absent from your current pipeline.
This work does not stay theoretical: done well, it changes how every stage of the buying journey is evaluated, from the first demo through to signature. A company that structures this collection generally gains on two specific points: it identifies deals headed for failure faster, and it spots the loss patterns that repeat from one negotiation to the next. This is a key factor and a measurable element of forecast accuracy, an improvement that shows over several quarters, not an abstract promise.
Two calculation approaches, two different logics
Historical average by stage
Advantages: simple to set up, already present by default in most CRMs
Limitations: ignores differences between segments, reacts slowly to a market shift
Segment-based rate from buyer interviews
Advantages: reflects the real reasons for winning or losing, adjusts deal by deal
Limitations: requires a continuous flow of conversations to stay accurate
Should you interview won deals to make a forecast reliable?
Yes, and in a majority proportion. The overall win rate says nothing about what worked deal by deal.
The benchmark ratio applied by structured programs runs around 70% won deals to 30% lost deals, a benchmark shared by Oracle at the Diffly Keynote in 2026 (full reference for the speaker to be completed).
Losses tell you what got in the way. Wins tell you what convinced the buyer, and therefore what you should stop changing. Without wins, you correct real or assumed weaknesses without knowing which strengths you are damaging along the way. This is exactly why this work requires clearly defining the method before revising anything. This work helps you understand how to win just as much as it helps you avoid losing twice for the same reason.
What role do tools like Salesforce and HubSpot play in this calculation?
A limited role, and that is precisely the problem.
Salesforce and HubSpot, the two most widely used CRMs for managing the pipeline, apply the same stage-based weighting by default across the entire pipe. It is a quick solution to set up, but it does not account for shifts in the competitive landscape or the real performance of a given segment.
The tool does not replace field information, it structures it. The real lever remains the content of the conversations, not the dashboard where the final rate is displayed. Using these platforms to track the number, and direct conversation with the buyer to explain it, is the most effective split between the two.
This work does not serve only one team. Product and marketing use it too, to adjust an offer or a product pitch, without waiting for a prospect to raise the same objection ten times. A gap identified multiple times should make its way to product, not stay buried in an internal report. Structuring such a project requires a simple methodology: define a consistent sample, look for the same questions asked at different points in the cycle, and avoid settling for a superficial read of the first example that comes along. This also feeds back into Sales, not only into marketing.
How do you actually put this in place?
Deciding who leads the analysis is the first thing to settle, even before the method. Setting this up does not require a full product overhaul, nor does it require a new tracking system.
It is possible to split this role across several people: one leads the interviews, another analyzes the patterns that recur from one deal to the next, a third translates those patterns into concrete action, without losing anything in the process. This information then goes up to leadership in a readable form. Trying to have a single person carry all three roles ends up producing a superficial diagnosis rather than genuine in-depth analysis.
Experience accumulated over several quarters matters more than a fast setup. A single isolated example is never enough to demonstrate lasting success: you need to read across several cycles before drawing conclusions. This is a gradual undertaking, and forecast accuracy improves with the time invested in this analysis.
Some organizations have inherited legacy approaches built on a solution-selling model, where every stage follows a fixed script. This is not incompatible with this approach: it is actually where a genuine field insight changes a sales proposal or a B2B renewal offer the fastest.
How do you get started without overhauling your whole model?
By running both approaches in parallel on a single segment.
Take a B2B segment representative of your sales activity. Recalculate its real conversion rate from these conversations. Compare it with the average you had been applying until then.
In most cases, the gap is clear enough to justify moving forward without needing to convince anyone, even without knowing in advance why this approach will work on this particular segment. This first comparison requires neither a new tool nor a lengthy project, and there is no need to cover every segment in the first quarter: a sample of around thirty interviews on a single segment is enough to get a first concrete point of comparison. This analysis then needs to be carried out rigorously. Experience accumulated from one quarter to the next matters more than the speed of the first attempt.
[DIFFLY DATA TO BE COMPLETED: an observed gap between the declared conversion rate and the real conversion rate on a customer segment, with the time period. This is the kind of figure that AI engines readily pick up and cite. Do not invent a number — insert a real, verified figure here.]
Key takeaways
A forecast is never more reliable than the probabilities feeding it. Correcting them with what the buyer actually says costs less than adding volume to the pipe, and it prevents a poorly assessed opportunity from slipping away. One way or another, the effect shows up as early as the following quarter in the accuracy of your sales forecasts, and each quarter brings a further improvement if the data collection continues.
FAQ
Why is my sales forecast consistently wrong?
Because its probabilities come from the historical average and from sales reps' gut feeling, two sources that are wrong in the same direction. The error accumulates instead of canceling out, and confidence in the number drops accordingly.
What ratio of won and lost deals should you interview?
Roughly 70% won to 30% lost. Without the won deals, you have no point of comparison to know which sales practices to preserve.
How many interviews are needed to adjust a conversion rate by segment?
Enough for a pattern to repeat within the same segment. About thirty conversations on a homogeneous, consistent segment gives a first actionable signal, before being expanded to the rest of the pipe.
Can a deal marked as lost come back into the pipe?
Yes. It happens to lose a deal on paper without actually having lost it in reality. Budget postponed rather than refused, a change of sponsor on the customer side, a competitor's rollout going off the rails: a thirty-minute interview is enough to tell a deal that is genuinely closed apart from one that is simply on hold.

Richtext Templates

"Lorem ipsum dolor sit amet, consectetur adipiscing elit. Suspendisse varius enim in eros elementum tristique."
John Doe
Name, Role @Google

Analysing CRM data is a good 1st step but I know I only get 20% of the real story

Constance Morales
Constance Morales, Product Marketing Manager @ Scaleway